
TL;DR
Bitcoin has experienced five significant peaks in price since its creation in 2009. So far, the cryptocurrency has had an all-time high of roughly 64,000 US dollars and increased mainstream adoption. The journey has been volatile, often reacting to political, economic, and regulatory happenings.
Bitcoin has experienced, on average, 200% growth per year. As of August 2021, Bitcoin’s market cap is roughly $710,000,000,000 and its crypto market dominance is just under 50%.
Events like the Mt. Gox exchange hack of 2014 and the 2020 stock market crash can explain some short and mid-term price behavior. In the long run, you can get a macro view by looking at models that use technical, fundamental, and sentiment analysis.
For technical analysis, Bitcoin’s Logarithmic Growth Curve and the Hyperwave Theory are two interesting models. The Hyperwave Theory also ties price into investor sentiment in cyclical phases. When it comes to fundamental analysis, the Stock to Flow and Metcalfe models track Bitcoin’s price reasonably well. Ultimately, you could use a combination of all of these methods to get a balanced view.
Introduction
Bitcoin (BTC) has captured the world’s imagination with its massive rise in value since 2009. However, it has not all been bull runs and gains. Bitcoin has experienced dips and bear markets too. Despite its volatility, the cryptocurrency has so far outperformed all traditional assets. A combination of multiple factors makes up the Bitcoin price history, and you can study them with different techniques and viewpoints.

How to analyze Bitcoin’s price history
Before we get into the data, let’s look at how you can analyze Bitcoin’s price history. There are three different methods: technical, fundamental, and sentiment analysis. Each type has its strengths and weaknesses but can be combined to form a clearer picture.
1. Technical analysis (TA): The use of historical price and volume data to try and predict future market behavior. For example, you could create a 50-day Simple Moving Average (SMA) by taking the last 50 days’ prices and averaging them. You can make inferences with the SMA by plotting it on your asset’s price chart. For example, imagine Bitcoin has been trading under the 50-day SMA for a few weeks but then breaks through it. This movement could be seen as a sign of a possible recovery.
2. Fundamental analysis (FA): The use of data representing the fundamental, intrinsic value of a project or cryptocurrency. This type of research concentrates on external and internal factors to try and establish an asset’s actual value. For example, you could look at Bitcoin’s daily transactions to measure the network’s popularity. If this number rises over time, it might suggest the project has value, and the price could increase.
3. Sentiment analysis (SA): The use of market sentiment to predict price movements. Market sentiment includes the feelings and mood of investors towards an asset. You can typically categorize these into bullish or bearish sentiments. For example, a significant increase in trending Google searches about purchasing Bitcoin could suggest positive market sentiment.
Which factors influenced early Bitcoin trading?
Next up is to explore the factors that influence trading and affect prices. These have changed over time from Bitcoin’s beginning. In 2009, Bitcoin was an extremely niche asset with low liquidity. Trades were made Over-the-Counter (OTC) between users on BitcoinTalk and other forums who saw Bitcoin’s value as a decentralized currency. The speculation that we see today played much less of a role.
Satoshi Nakamoto mined the first block on January 03, 2009, with a reward of 50 bitcoins. He then sent 10 BTC to Hal Finney nine days later in the first-ever Bitcoin transaction. On May 22, 2010, Bitcoin still had a price of less than $0.01. That day also saw the first commercial Bitcoin transaction with Laszlo Hanyecz purchasing two pizzas for 10,000 BTC. At the time, users on the Bitcointalk forums saw the purchase as a novelty. This trade contrasts with current use, where you can purchase everyday goods easily with a Binance Visa Card.
As Bitcoin’s price and popularity rose, a small, unregulated industry became increasingly involved in facilitating transactions and trading. These included cryptocurrency exchanges and deep web markets. Bitcoin’s price was often significantly affected as these markets and exchanges were hacked, closed, or regulated. Some hacked exchanges held substantial Bitcoin supplies, causing significant price shocks and a lack of market confidence. We’ll explore this topic further later on.
Which factors influence Bitcoin trading now?
Bitcoin now shares more in common with traditional assets than in its early days. Increased adoption in retail, finance, and politics means even more factors affect Bitcoin’s price and trading. Institutional investment in virtual currencies is also growing, giving speculation a bigger role. These points mean that the factors that affect Bitcoin's trading today are often different from those in its early days. Let's discuss some of the largest ones.
1. Regulation is now much more present than in Bitcoin’s earlier days. As governments begin to understand cryptocurrencies and blockchain technology more, their control and regulatory input tend to increase. Both the tightening and loosening of regulations have their impacts. Some changes in Bitcoin’s price are related to the banning of BTC in one country or its popularity in another.
2. The state of the global economy is now a direct factor in Bitcoin’s price and trading. For example, people living in countries with hyperinflation have turned to cryptocurrencies as a hedge against inflation. As a result of Venezuela’s economic crisis beginning in 2016, we’ve seen record-high trading volume on LocalBitcoins in Venezuelan Bolivar. The 2020 stock market crash saw the beginning of the Bitcoin bull run that lasted over a year. Bitcoin is now seen as a store of value, much like gold. When confidence is low in other parts of the economy, people purchase these assets.

3. Increasing mainstream adoption from large companies can trigger rallies in Bitcoin’s price. PayPal, Square, Visa, and MasterCard have all shown some support for cryptocurrencies, giving investors confidence. Retailers have even started accepting Bitcoin payments. The withdrawal of support can also trigger selloffs, such as Elon Musk’s announcement on May 17, 2021, of Tesla halting Bitcoin payments. In this case, the price went from just under $55,000 per BTC to roughly $48,500 that day.

4. Increased speculation and derivatives such as Bitcoin futures have driven extra demand in the market. Rather than invest and hold BTC for its fundamental value, traders and speculators in the futures market short BTC for profit, causing downward pressure on the price. This means that Bitcoin’s price is no longer solely based on its utility.
Bitcoin’s price history
Since 2009, Bitcoin’s price has been subject to large volatility. The factors mentioned above have all contributed to its journey so far. Although the price has had its ups and downs, the price is still dramatically higher than when it began.
When we compare Bitcoin to the NASDAQ 100 and gold, you can see it has vastly outpaced these two traditionally strong-performing assets. You can also see its volatility, as Bitcoin’s yearly losses are also greater in percentage terms than any losses experienced by gold or the NASDAQ 100 (data from @CharlieBilello).
According to CaseBitcoin, BTC has shown a 10-year CAGR (compound annual growth rate) of 196.7%. CAGR measures an asset’s annual growth rate taking into account compounding. There have been five significant peaks in Bitcoin’s price, rising from only $1 in 2011 to an all-time high of $65,000 in May 2021. Let’s break down the history so far into five distinct peaks.

1. June 2011: From a price measured in just cents the year before, Bitcoin made a meteoric rise to $32. Bitcoin experienced its first bull run followed by a moderate crash down to $2.10.
2. April 2013: After beginning the year at roughly $13, Bitcoin experienced its first bull run of the year, rising to $260 on April 10, 2013. The price then crashed over the next two days down to $45.
3. December 2013: By the end of the year, Bitcoin experienced an almost 10-times price increase between October and December. At the beginning of October, BTC was trading at $125 before reaching its peak of $1,160. By December 18, the price had once again crashed to $380.
4. December 2017: After starting at roughly $1,000 in January 2017, Bitcoin saw a meteoric rise in price to just under $20,000 by December 17, 2017. This bull run cemented Bitcoin’s position in the mainstream, catching the attention of institutional investors and governments.
5. April 2021: Crashes in the stock market and crypto market in March 2020 led to a sustained price rise up to $63,000 by April 13, 2021. With economic instability from the Coronavirus pandemic, Bitcoin was seen by some as a store of value. BTC and the crypto market then saw a significant selloff in May 2021 before stagnating in price.

Short-term price events
The fundamental and technical models we’ll use later can’t always describe the price behavior we see. External factors, including political and economic events, play large roles that you can analyze individually. One interesting example to look at is a famous hack that took place in Bitcoin’s early days.
The Mt. Gox exchange hack
The Mt. Gox Bitcoin exchange hack was a significant event in 2014 that led to a temporary drop in Bitcoin’s price. At the time, the Tokyo-based crypto exchange was the largest on the market, with a trading volume of roughly 70% of Bitcoin’s total supply. Since its creation in 2010, Mt. Gox had been the victim of numerous hacks but had continued to survive.
However, 2014’s hack saw roughly 850,000 BTC stolen, wiping out most of the exchange’s digital assets. Mt. Gox suspended withdrawals on February 14, 2014, leading to an approximately 20% decrease in Bitcoin’s price to around $680 after trading at $850 for most of the week.
Ultimately, hackers took $450,000,000 (USD) of user’s funds, and Mt. Gox went bankrupt. Some former users claim there were issues with the website’s code that were not fixed in time. The reasons behind the hack are still not clear to this day, leading to multiple ongoing lawsuits and legal action against the exchange’s CEO Mark Karpelès.
How do we explain Bitcoin’s long-term price history?
In the long run, smaller, less-important events have a minor impact on price. For this reason, it’s interesting to look at other ways to explain Bitcoin’s overall positive trajectory. One option is to study analytical models that use the techniques we already mentioned above.
Fundamental analysis: Stock to Flow model
The Stock-to-Flow model uses Bitcoin’s limited supply as a possible indicator of price. At a basic level, Bitcoin is somewhat similar to gold or diamonds. Over time, these two commodities’ prices have risen due to their scarcity. This factor lets investors use them as stores of value.
If you take the total circulating global supply (stock) and divide it by the total amount produced by year (flow), you can use this ratio to model Bitcoin’s price over time. We already know the exact amount of new bitcoins miners will generate and roughly when they will receive them. Put simply, mining returns are decreasing, and this creates an increasing stock-to-flow ratio.
Stock to Flow has proven popular due to its accuracy so far in modeling Bitcoin’s price history. You can see below a 365-day SMA and Bitcoin’s historical price data and the prediction it gives going into the future.
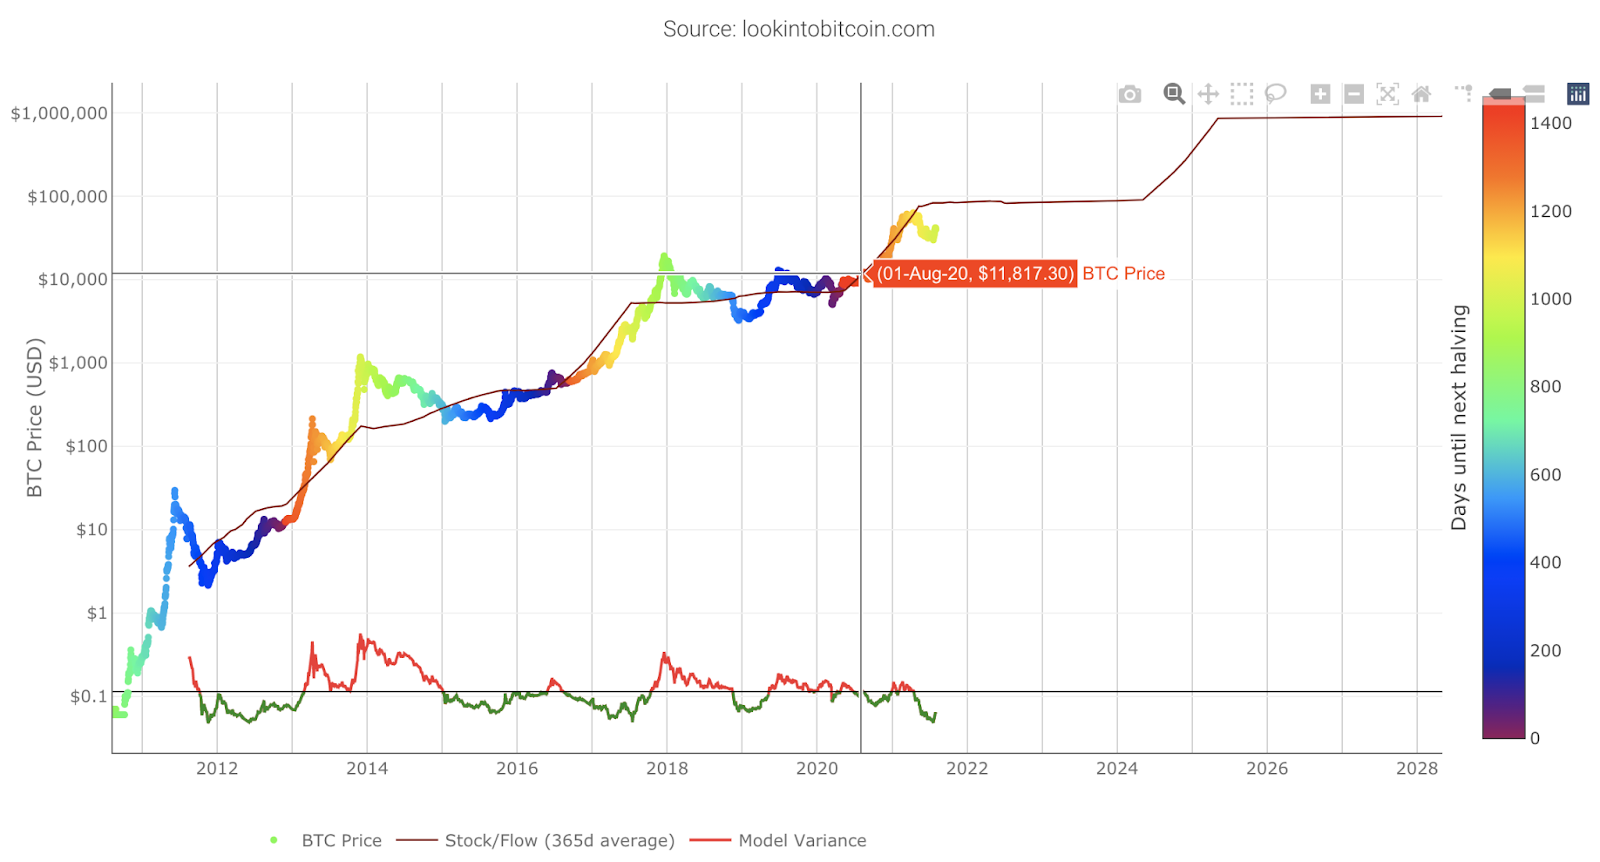
The model does have some drawbacks. Over time, when Bitcoin’s flow reaches zero, the model will eventually break as you can’t divide by zero. This calculation gives implausible price predictions that tend to infinity. You can read more about Stock to Flow’s advantages and disadvantages in our Bitcoin and the Stock to Flow Model article.
Fundamental analysis: Metcalfe’s Law
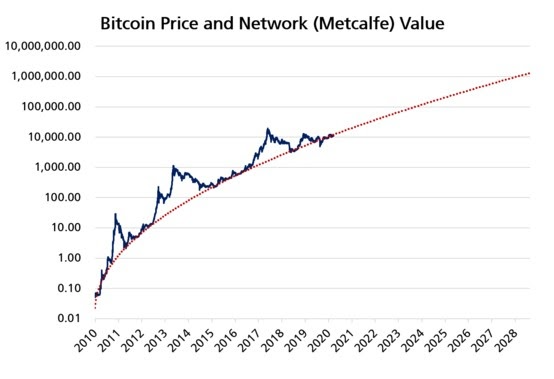
Metcalfe’s law is a general computing principle that you can also apply to the Bitcoin network. It states that the value of a network is proportional to the square of the number of connected users. What does this mean exactly? An easy-to-understand example is the phone network. The more people who own phones, the more exponentially valuable the network becomes.
With Bitcoin, you can calculate a Metcalfe value by using the number of active Bitcoin wallet addresses and other public information on the blockchain. If you plot the Metcalfe value against price, you can see a reasonably good fit. You can also extrapolate the trend to predict possible future prices, as Timothy Peterson has done in his graph below.
The Network Value to Metcalfe ratio (NVM) provides another use of Metcalfe’s law. You can calculate the ratio by taking Bitcoin’s market cap and dividing it by a formula approximating Metcalfe’s law. The formula uses the number of active unique addresses on a specific day as a stand-in for the network’s users. Unique addresses are defined as having a non-zero balance and also making a transaction that day.
A value over one indicates the market is overvalued and below one that it’s undervalued. You can see how this looks visually with the following graph from Cryptoquant. The NVM ratio is the left axis, while the network value is on the right.

Technical analysis: Bitcoin’s Logarithmic Growth Curve
Bitcoin’s Logarithmic Growth Curve is a 2019 technical analysis model created by Cole Garner. Standard Bitcoin price charts display the logarithmic (log) price against linear time on the x-axis. However, if you also log time, you can draw simple trend lines that match the tops of the last three bull runs and Bitcoin market support levels.
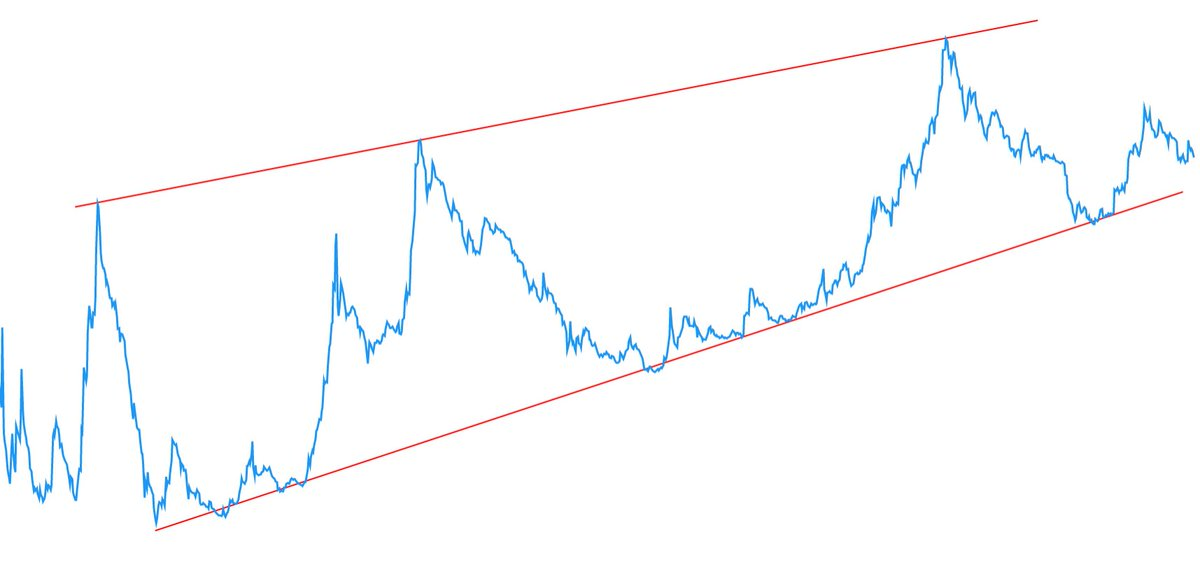
These lines can be transformed back onto our original log price graph, providing us with a growth curve that has fairly accurately matched Bitcoin’s price history so far, as seen in the following chart from LookIntoBitcoin.com.

Technical Analysis: Hyperwave Theory
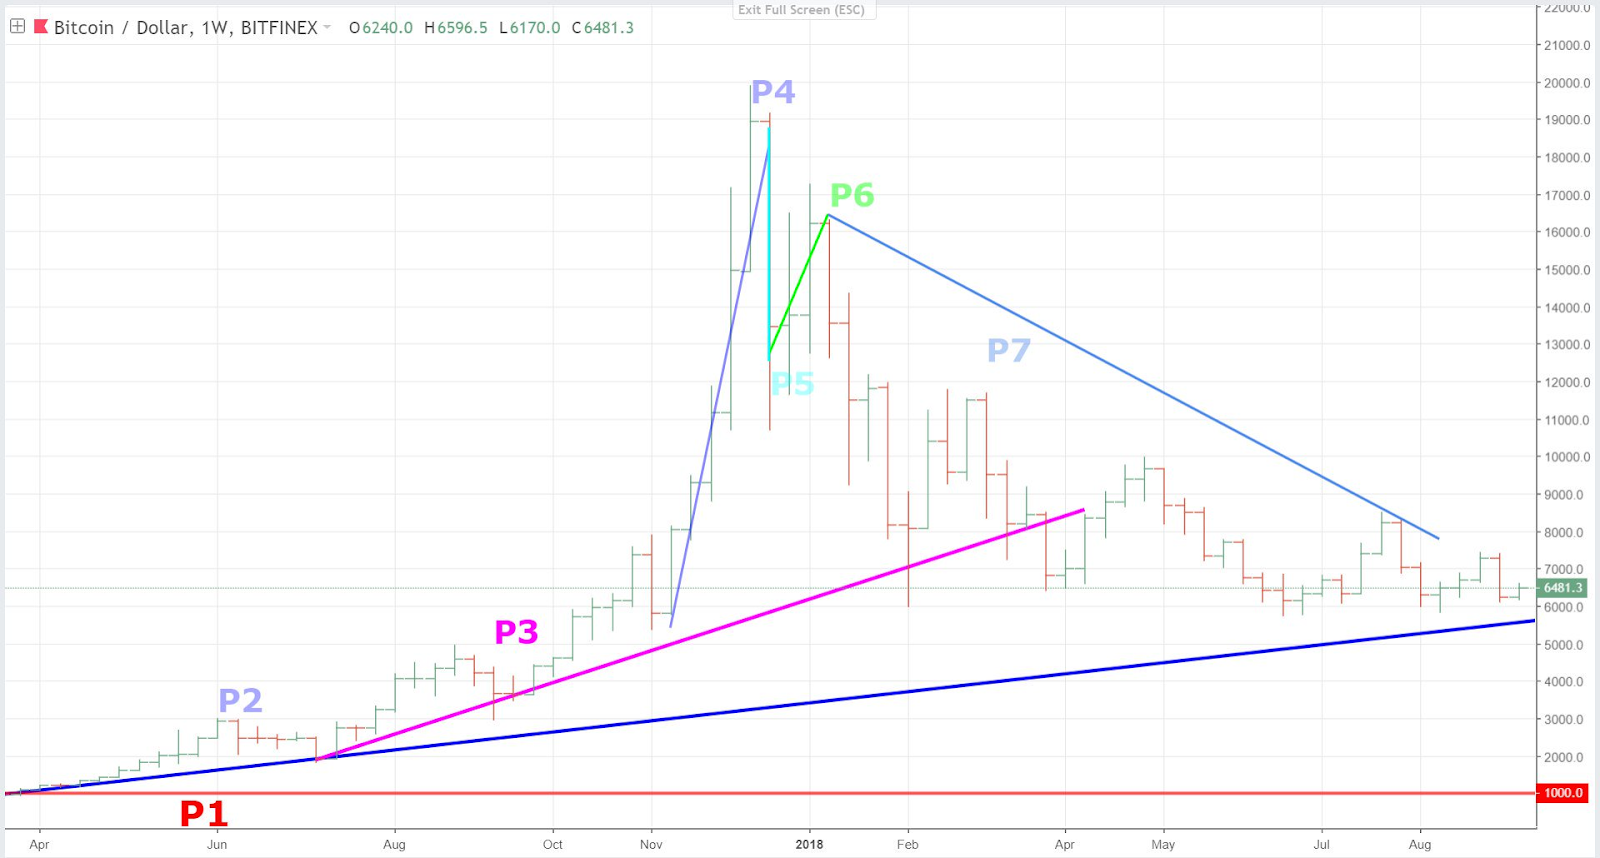
Hyperwave Theory was developed by Tyler Jenks and attempts to explain prices through investor emotions. The theory suggests that market sentiment repeatedly moves between pessimism and optimism. These feelings often lead to a Hyperwave where the price climbs over time before reversing into a bearish trend. Although Jenks theorizes the pattern arises from market sentiment, the graph only uses technical analysis with price data to draw its trend lines. According to the Hyperwave Theory, there are seven phases in each market cycle.

In phases 1, 5, and 7, the asset’s price should stay below the resistance line. In phases 2, 3, 4, and 6, the price should remain above the support lines. Not every asset will stick to the rules completely, but there is evidence of the pattern existing in some markets. You can see below a rough example of the NASDAQ Composite 2000, graphically demonstrated by Leah Wald (CEO of Valkyrie Investments Inc.).

Let’s take a look at the Bitcoin bull run of 2017. If you apply the Hyperwave theory trends, you can see that it has a relatively good fit apart from phase one. You can also see the price rising at increasing speed, followed by a large crash that mainly follows the phases set out above.
Closing thoughts
It’s obvious to see that there are a lot of theories out there that try to explain Bitcoin’s price history. But no matter the answer, Bitcoin’s almost 200% 10-year CAGR has shown the incredible rise of digital currencies. Even within cryptocurrencies, Bitcoin shows a market dominance of just under 50% as of August 2021, with a market cap of roughly $710,000,000,000.
The reasons behind this monumental growth include the crypto’s fundamentals, market feeling, and economic events. However, past performance is not indicative of future results. It’s helpful to understand why Bitcoin has had such a high price trajectory, but it doesn’t tell us what will happen in the future. When we look at the bigger picture, Bitcoin has matured incredibly well for a new asset class that’s only 12 years old.