In simple terms, the Stock to Flow (SF or S2F) model is a way to measure the abundance of a particular resource. The Stock to Flow ratio is the amount of a resource held in reserves divided by the amount it is produced annually.
The Stock to Flow model is generally applied to natural resources. Let’s take the example of gold. While the estimates may vary, the World Gold Council estimates that around 190,000 tons of gold have ever been mined. This amount (i.e., the total supply) is what we can refer to as the stock. Meanwhile, there are about 2,500-3,200 tons of gold mined each year. This amount is what we can refer to as the flow.
We can calculate the Stock to Flow ratio using these two metrics. But what does it actually mean? It essentially shows how much supply enters the market each year for a given resource relative to the total supply. The higher the Stock to Flow ratio, the less new supply enters the market relative to the total supply. As such, an asset with a higher Stock to Flow ratio should, in theory, retain its value well over the long-term.
In contrast, consumable goods and industrial commodities will typically have a low Stock to Flow ratio. Why is that? Since their value typically comes from them being destroyed or consumed, the inventories (the stock) are usually only there to cover demand. These resources don’t necessarily have high value as possessions, so they tend to work poorly as investment assets. In some exceptional cases, the price might rise quickly if there’s an anticipation of shortage in the future, but otherwise, production keeps up with demand.
It’s important to note that scarcity alone doesn’t necessarily mean that a resource should be valuable. Gold, for example, isn’t all that rare – after all, there are 190,000 tons available! The Stock to Flow ratio suggests that it’s valuable because annual production compared to the existing stock is relatively small and constant.
Historically, gold has had the highest Stock to Flow ratio out of precious metals. But how much is it exactly? Going back to our previous example – let’s divide the total supply of 190,000 tons by 3,200, and we get a Stock to Flow ratio of ~59. This tells us that at the current production rate, it would take around 59 years to mine 190,000 tons of gold.
It’s worth keeping in mind, though, that the estimates for how much new gold will be mined each year are just that – estimates. If we increase the annual production (the flow) to 3,500, the Stock to Flow ratio decreases to ~54.
While we’re at it, why not calculate the total value of all gold that’s been mined? This, in some ways, can be compared to the
market capitalization of cryptocurrencies. If we take a price of about $1500 per troy ounce of gold, the total value of all gold comes to around $9 trillion. This sounds like a lot, but actually, if you’d combine it all into one cube, you could fit that cube into a single football stadium!
Comparably, the highest total value of the
Bitcoin network had been around $300 billion in late 2017 and is hovering around $120 billion at the time of writing.
If you understand how
Bitcoin works, it won’t be difficult for you to understand why applying the Stock to Flow model to it might make sense. The model essentially treats bitcoins comparably to scarce commodities, like gold or silver.
Gold and silver are often called
store of value resources. They, in theory, should retain their value over the long term due to their relative scarcity and low flow. What’s more, it’s very difficult to significantly increase their supply within a short period of time.
According to the advocates of the Stock to Flow model,
Bitcoin is a similar resource. It’s scarce, relatively costly to produce, and its
maximum supply is capped at 21 million coins. Also, Bitcoin’s supply issuance is defined on the protocol level, which makes the flow completely predictable. You also might have heard about the
Bitcoin halvings, where the amount of new supply entering the system is halved every 210,000 blocks (roughly four years).
BTC Total Supply Mined (%) and Block Subsidy (BTC).
According to the proponents of this model, these properties combined create a scarce digital resource with profoundly compelling characteristics to retain value over the long-term. In addition, they assume that there’s a statistically significant relationship between Stock to Flow and market value. According to the model’s projections,
Bitcoin’s price should see a significant increase over time due to it’s continually reduced Stock to Flow ratio.
The current
circulating supply of
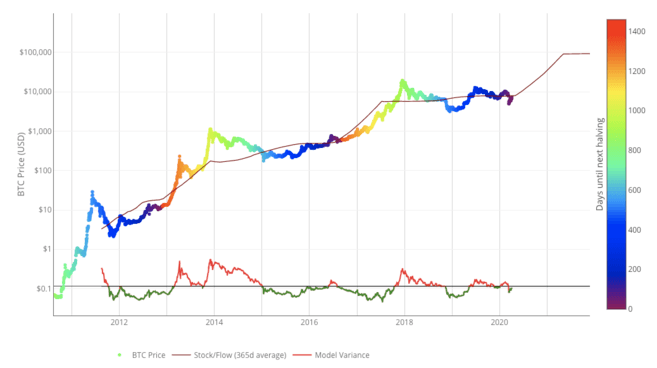
Bitcoin is approximately 18 million bitcoins, while the new supply is approximately 0.7 million per year. At the time of writing, Bitcoin’s Stock To Flow ratio is hovering at around 25. After the next halving in May 2020, the ratio will increase to the low 50s.
In the image below, you can see the historical relationship of the 365-day
moving average of Bitcoin’s Stock to Flow with its price. We’ve also indicated the dates of the
Bitcoin halvings with color coding of the BTC price line.
Sneak a peek at the latest Bitcoin (BTC) prices today.
While Stock to Flow is an interesting model for measuring scarcity, it doesn’t account for all parts of the picture. Models are only as strong as their assumptions. For one thing, Stock to Flow relies on the assumption that scarcity, as measured by the model, should drive value. According to critics of Stock to Flow, this model fails if Bitcoin doesn’t have any other useful qualities other than supply scarcity.
Gold’s scarcity, predictable flow, and global liquidity have made it a relatively stable store of value compared to fiat currencies, which are prone to devaluation.
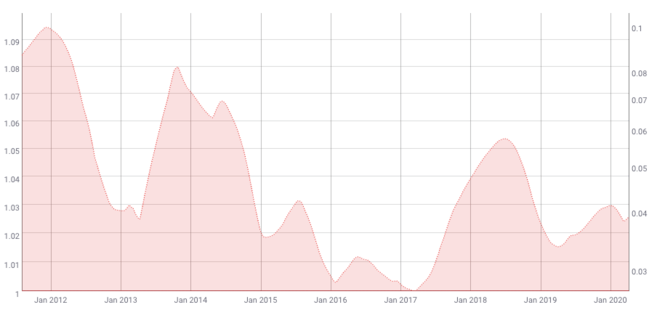
According to this model, Bitcoin’s volatility should also decrease over time. This is confirmed by historical data from Coinmetrics.
200-day Moving Average of 180-day Volatility of Bitcoin. Source: Coinmetrics.io
The valuation of an asset requires taking into account its volatility. If the volatility is predictable to some extent, the valuation model may be more reliable. However, Bitcoin is notorious for its large price moves.
While volatility might be decreasing on the macro level, Bitcoin has been priced in a free market from its inception. This means that the price is mostly self-regulated on the open market by users, traders, and speculators. Combine that with relatively low
liquidity, and Bitcoin is likely to be more exposed to sudden spikes of volatility than other assets. So the model may not be able to account for this either.
Other external factors, such as economic
Black Swan events, could also undermine this model. Though it’s worth noting that the same applies to essentially any model that tries to predict the price of an asset based on historical data. A Black Swan event, by definition, has an element of surprise. Historical data can’t account for unknown events.
The Stock to Flow model measures the relationship between the currently available stock of a resource and its production rate. It’s typically applied to precious metals and other commodities, but some argue it may be applicable to Bitcoin as well.
In this sense, Bitcoin may be viewed as a scarce digital resource. According to this method of analysis, the unique propositions of Bitcoin should make it an asset that retains its value over the long-term.
However, every model is as strong as its assumptions, and it may not be able to account for all aspects of Bitcoin valuation. What’s more, at the time of writing, Bitcoin has only been around for a little more than ten years. Some might argue that long-term valuation models like the Stock to Flow need a larger data set for more reliable accuracy.