Resistance
Beginner
Resistance consists of a level in which the price of an asset fails to break through due to strong selling pressure. In some cases, the occurrence of resistance levels may also be related to big sell walls, that prevent the price from rising further.
So a resistance level is expected to act as a “ceiling,” caused by a large supply of sellers in that price area. As such, traders can interpret resistance as a level that can only be surpassed with significant buying pressure.
Typically, technical analysists draw resistance lines based on previous highs. Such a technique may be useful when trying to predict potential points of price reversal. In general, resistance levels are depicted as straight horizontal lines, but they may also be drawn as diagonals. However, diagonals are often referred to as trend lines.
It is important to note that a resistance level, when surpassed, tend to become a support level - which is basically the opposite concept. While resistance lines often act as a ceiling, preventing the price from rising further, support levels act as a “floor” that tends to hold the price above it. Typically, good trading opportunities arise when resistance or support levels are broken.
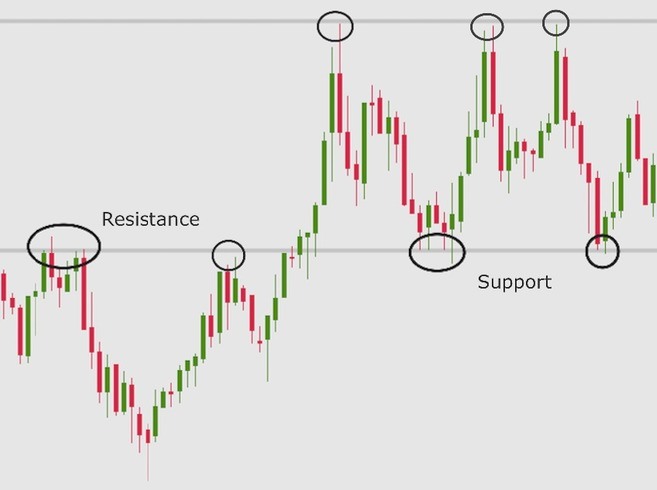
When drawing resistance zones or lines, it is recommended that you consider at least two previous highs (ideally three or more). The more points you use to sustain your technical analysis, the more reliable it will be. The same is valid for support and trend lines drawings.
However, as most technical analysis tools and indicators, relying on support and resistance lines alone is quite risky. Combining such tools with proper fundamental analysis, as well as other technical indicators, will likely reduce risks.