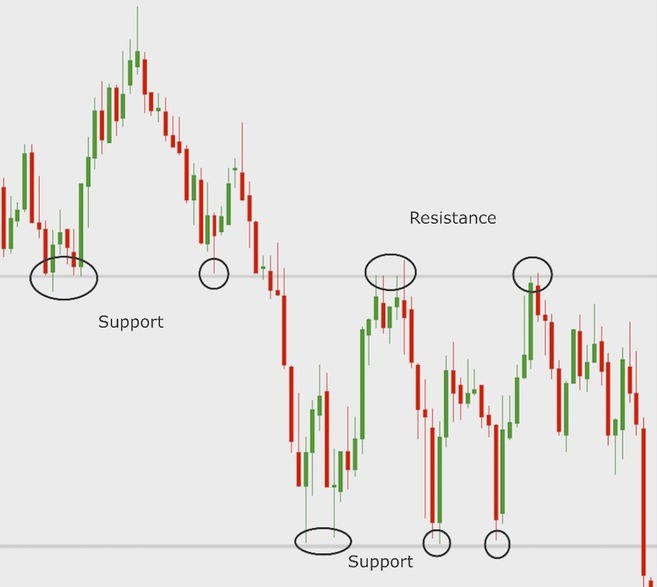
Support
As such, a support level is expected to act as a “floor,” and it’s usually caused by a large supply of buyers in a certain price region. So we may consider support levels as points in which the price can only break down with strong selling pressure.
In general, traders and chartists draw support lines based on previous lows. This approach can come handy when trying to predict potential points of a price reversal, which may indicate a good opportunity to buy. Although they are mostly depicted as straight horizontal lines, support levels may also be represented by diagonals. However, diagonals are usually referred to as trend lines.
The name to describe the moment when/if Ethereum (ETH) surpasses Bitcoin (BTC) in terms of market capitaliz...
The name to describe the moment when Litecoin (LTC) surpassed Bitcoin Cash (BCH) in terms of market capital...
When the market price of an asset and a technical indicator (e.g. RSI, Volume, MACD) are heading in opposit...