Support
Beginner
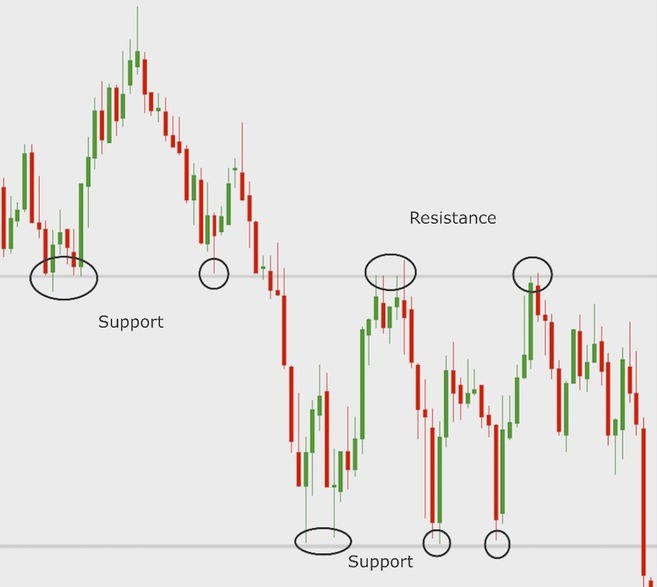
Support refers to a level that tends to hold the price of an asset, preventing it from going down. The occurrence of support levels is caused by a strong buying pressure at that price zone, but it may also be related to big buy walls that can make it harder for the price to drop further.
As such, a support level is expected to act as a “floor,” and it’s usually caused by a large supply of buyers in a certain price region. So we may consider support levels as points in which the price can only break down with strong selling pressure.
In general, traders and chartists draw support lines based on previous lows. This approach can come handy when trying to predict potential points of a price reversal, which may indicate a good opportunity to buy. Although they are mostly depicted as straight horizontal lines, support levels may also be represented by diagonals. However, diagonals are usually referred to as trend lines.
When a support level is broken, it tends to become a resistance level, which would then present an opposite effect. So instead of acting as a support, the line would now act as resistance, acting as a ceiling that is likely to prevent the price from rising further. Typically, good trading opportunities arise when resistance or support levels are broken.

When drawing support lines or zones, it is advised that you consider at least two previous lows (ideally three or more). The more points you use to back your analysis, the more reliable it will be. The same is valid when drawing resistance and trend lines.
However, as most technical analysis tools and indicators, relying on support and resistance lines alone can be very risky. To reduce the risks, it’s recommended that you combine the use of such tools with proper fundamental analysis - as well as other technical indicators.